I was completely lost! It was hard to wrap my head around it all. Fortunately, now it is even easier and more fun to enjoy observing bird migration by radar, and this post can help you get started. Just wait until after dark (when the birds are moving), and follow these steps.
Step 1--Find your NEXRAD radar site
A) Go to Wunderground.com's NEXRAD site. You should see a map of the U.S. like this:
B) Each plus sign is a radar station, click on the one closest to your location. That will show you a NEXRAD image like this:
That's it! You're all set to start watching bird migration!
Step 2--Read the radar map
The map shows how much reflectivity (water droplets, birds, insects, etc.) is in the atmosphere. This is measured in dBZ (decibels). For our purposes all you need to know is that the higher the dBZ, the more water, birds, or bugs are being detected.
So for the radar image above, you can see that reflectivity is from 8 to 24 dBZ across most of central Pennsylvaina. Here's a chart to help you determine how many birds may be represented by each dBZ level shown on the map:
Of course, big birds will reflect more than small birds, and these are just ballpark figures, but it does give some idea of how many birds may be going over at any given location. So in the image above, the dBZ ranging from 16 to 24 over Central PA would represent a moderate to heavy migration event, with hundreds of birds in every cubic kilometer of sky.
But that is only if the radar is really showing birds, and not just water or bugs in the air. You are ready now for the next step:
Step 3--Make Sure You are Seeing Birds, not Bugs or Water
A) At the top right of your radar image, click on the Select Radar Type button (see red arrow below).
That will take you to an options screen like this:
Notice that you were previously seeing Base Reflectivity 0.50 Elevation. That is just showing how much stuff is in the air. What you want to do is check out the movement of that stuff. To do that...
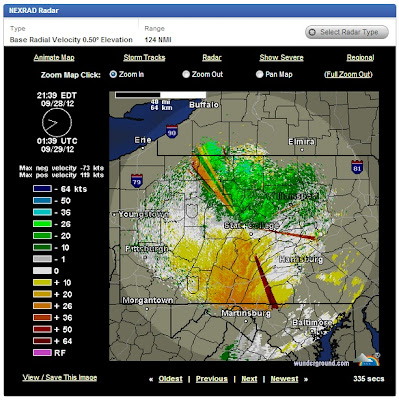
B) Click Base Radial Velocity 0.50 Elevation (circled in red). That will give you an image like this:
 |
| Bird migration over central PA, early evening 28 Sep 2012. |
This is showing the movement of the water, birds, or bugs in the atmosphere, relative to the radar station in the middle of the circle.
Green = Movement Towards the Station
Yellow/Orange = Movement Away from the Station
So in this image, things are moving north to south. At the top of the map they are moving at 10-35 knots towards the station, and things at the bottom are moving 10-26 knots away from station. White is showing movement parallel to the station. When you see a green, white, and orange image like this in the fall, good chance you are looking at migration. In the spring, migration is going the other way so you will see an image with green on the bottom, like the one at the top of this post. Having fun yet? You're almost home, just one more thing.
Bugs usually move at the same speed that the wind does, so if this movement is faster than the wind speed, you can be pretty sure you are seeing birds! So that just leaves one step to make sure:
Step 4--Check Wind Speeds
Go to the Intellicast Current Winds Page. That will get you a map like this:
Wind directions are shown by arrows, wind speed by the color on the map. So for Central PA, you can see that the winds are from the north or west at less than 10 knots. Since the movement in the radar is much faster than that, you can be pretty sure you are seeing birds.
BTW, if this wind map is hard for you to read, you might enjoy this animated map showing wind directions and speed.
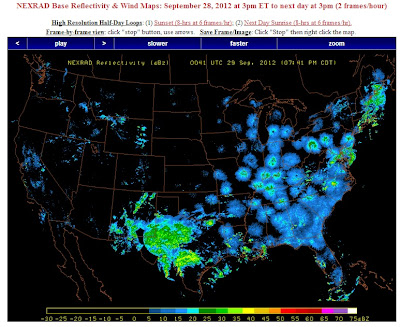
One last thing. If you want to see migration happening all across the Lower 48, check out the live and archived animated radar loops on the Birding by Radar site (scroll to bottom of the page). You can see storms (which will show a heavier dBZ pattern) moving across the landscape, and then the explosion of bird migration after dark each night. It's mind blowing!
 |
| Bird migration across the Eastern U.S., with storms over West Texas. |
While this is just an introduction to radar ornithology, this is pretty much 90% of it right here. If you go to these sites and follow these steps, you are doing radar ornithology! Now you can keep your finger on the pulse of bird migration (and moving weather systems) and be even more in tune with the world around you. Enjoy!
If you want to go beyond Radar Ornithology 101, you can take your enjoyment to the next level and find more info here:


Thanks!
ReplyDeleteI've always wondered how this was done, thanks for explaining it so well!
ReplyDeleteFantastic explanation! This upcoming week is supposed to be getting us into the peak of migration here, so I'll try it out!
ReplyDeletevery informative post - checking it out now.
ReplyDeleteSuper post! Thanks for making it easy.
ReplyDeleteGood stuff here Rob! Out west we don't seem to get the same radar benefit so I haven't embraced it as much as I would want to. Pretty cool ability though! Thanks for showing us how simple it can be.
ReplyDeleteFascinating! Great explanation. I'm off to check the radars out!
ReplyDeleteThis comment has been removed by the author.
ReplyDeleteGreat Article, will be using this information to keep our followers informed on migration trends. Thank You
ReplyDelete